In today’s data-driven world, businesses need effective tools to make sense of their data and make informed decisions. Microsoft’s Power BI is one such tool, designed to help organizations visualize and analyze their data. In this blog, we’ll explain what Power BI is, how it works, and how businesses use it.
Table of Contents
What Is Power BI?
Power BI is a set of business analytics tools by Microsoft. It allows users to create interactive reports and dashboards, making it easier to understand and share insights from data. The main components of Power BI include:
- Power BI Desktop: A Windows application for creating reports and visualizations.
- Power BI Service: An online platform for sharing, publishing, and collaborating on reports.
- Power BI Mobile: Mobile apps for accessing reports and dashboards on the go.
- Power BI Report Server: An on-premises server for organizations that need to keep their data on their own infrastructure
How Power BI Works
Connecting to Data
Power BI can connect to a wide range of data sources, such as Excel files, cloud services like Azure, on-premises databases like SQL Server, and even big data sources like Hadoop. This flexibility allows users to gather data from multiple sources for comprehensive analysis.
Transforming Data
With Power Query, users can clean, transform, and merge data from various sources. This process, known as data shaping, ensures that the data is accurate and ready for analysis. Power Query’s easy-to-use interface allows users to perform these tasks without needing to write code.
Visualizing Data
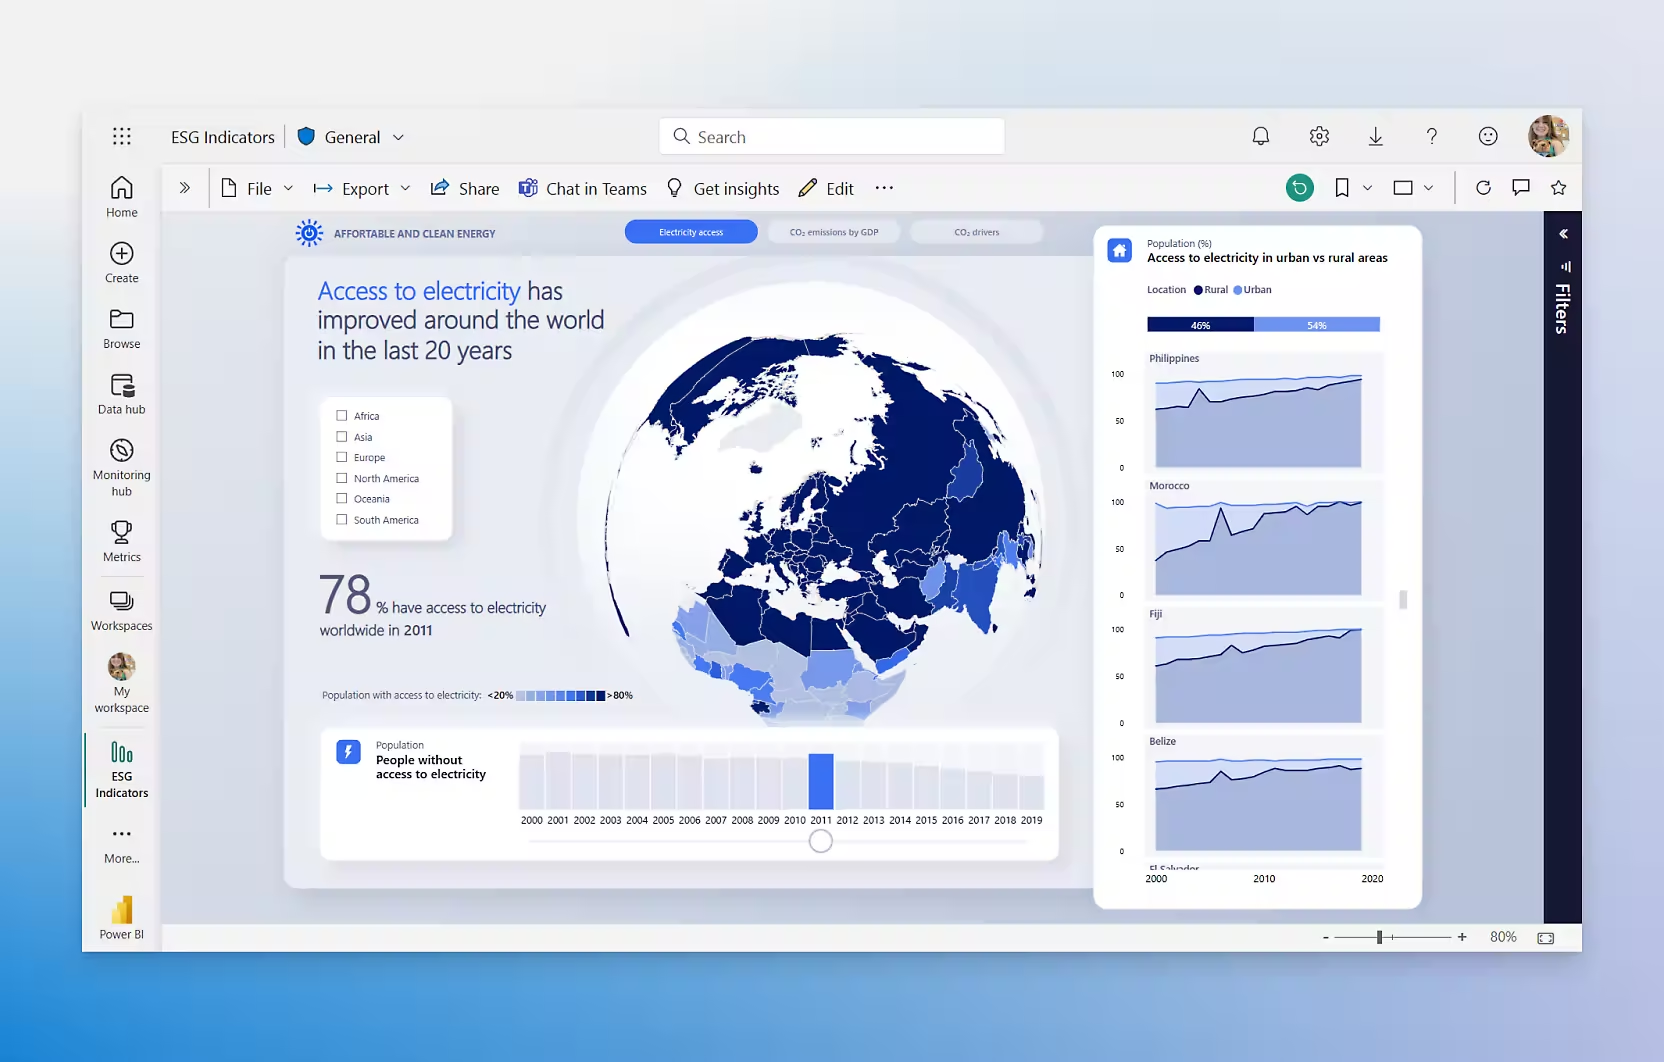
Power BI offers a wide range of interactive visualizations, including charts, graphs, maps, and tables. These visualizations are customizable, allowing users to create reports that clearly communicate their data insights. The drag-and-drop interface makes it easy to build these visualizations.
Real-Time Dashboards
Power BI enables users to create real-time dashboards that display up-to-date information. These dashboards allow businesses to monitor key metrics and respond quickly to changes. Real-time dashboards are useful for tracking sales, operational metrics, and other critical business indicators.
Sharing and Collaboration
Power BI makes it simple to share reports and dashboards with others. The Power BI Service allows users to publish and share their work, collaborate in real-time, and embed Power BI content into other applications like SharePoint or Microsoft Teams.
Advanced Analytics
For more in-depth analysis, Power BI integrates with R and Python, popular data analysis languages. It also includes AI features like natural language querying and machine learning to help users uncover deeper insights.
How Businesses Use Power BI
Business Intelligence
Organizations use Power BI to monitor performance metrics, track key performance indicators (KPIs), and gain insights into their operations. By visualizing data, businesses can identify trends, spot patterns, and make informed decisions.
Financial Analysis
Finance teams use Power BI to analyze financial data, track budgets, forecast revenues, and monitor expenses. Power BI helps finance professionals understand financial performance and make better financial decisions.
Marketing Insights
Marketing teams use Power BI to measure campaign performance, analyze customer behavior, and optimize marketing strategies. By integrating data from various channels, Power BI provides a comprehensive view of marketing activities and helps improve return on investment (ROI).
Sales Reporting
Sales teams use Power BI to track sales data, manage pipelines, and measure performance against targets. Real-time dashboards and interactive reports help sales professionals monitor their progress and identify opportunities.
Operational Efficiency
Operations managers use Power BI to streamline processes, monitor resource use, and improve efficiency. Visualizing operational data helps managers identify bottlenecks, optimize workflows, and enhance productivity.
Conclusion
Power BI is a powerful tool that helps organizations turn data into actionable insights. Its user-friendly interface, robust features, and seamless integration with other Microsoft products make it a valuable asset for any business. Whether you’re new to data analysis or looking to enhance your capabilities, Power BI provides the tools you need to succeed in today’s data-driven world.
Ready to harness the power of your data? Explore Power BI today and see how it can transform your data analysis and decision-making processes.
Author-Shahul
Learner of DigiSkillz, Digital Marketing Institute in Kochi.











Leave A Comment